How Are US Grain Exports Doing?

The US dollar index turned technically bullish at the end of July, raising the question of a possible ripple effect on demand for US commodities.
The pace projection of total marketing year export shipments of US corn and soybeans have decreased from late October/early November 2024, but are still ahead of last marketing year's totals.
All wheat export shipments have been solid, though it is still early in the 2025-2026 marketing year.
As I talked about recently, from a technical point of view the US dollar index looks to have moved into a long-term uptrend at the end of July. Fundamentally this would indicate the US Federal Open Market Committee could make rate hikes before the next cut is announced, despite all the bluster from the US administration. On the other hand, the technical pattern on the greenback’s monthly chart could be nothing more than a shift in long-term investment opinion, meaning it might have nothing to do with fundamentals, for now. Given the widely held belief that US exports are still tied to the strength and/or weakness of the dollar – something I don’t hold as true when the US has a one-word trade policy: Tariffs – how have US export sales and shipments of grain done through the end of July? The latest weekly update, for the week ending Thursday, July 31, showed some interesting numbers.
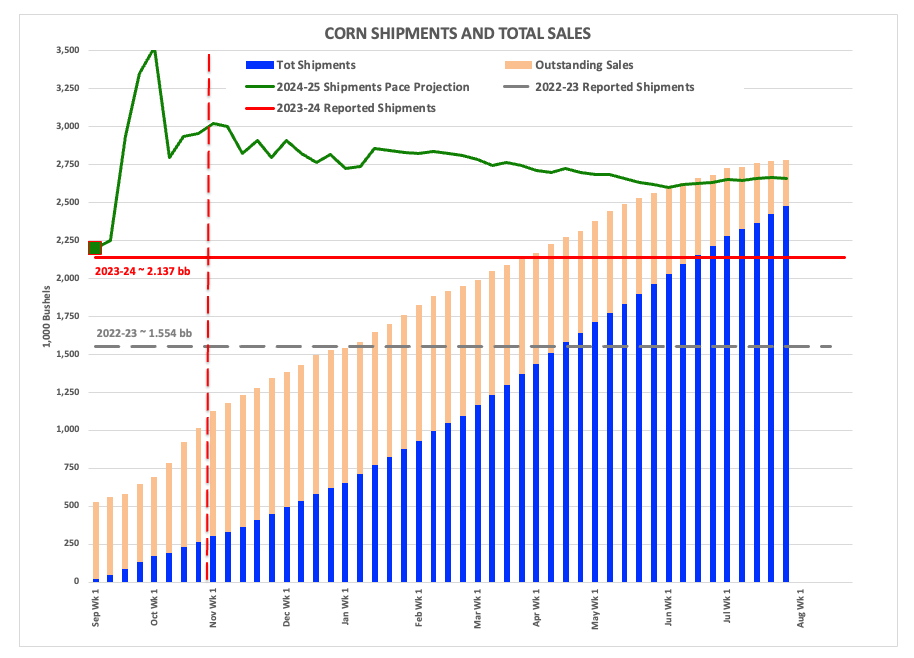
CORN: 2024-2025 marketing year export shipments of U.S. corn ($CNCI) were 2.476 bb (blue column), a point in the marketing year when a 5-year average of 93% of what turns out to be total exports have been shipped. This pace projects total 2024-2025 exports of 2.662 bb[i] (solid green line), up 25% from 2023-2024’s reported shipments of 2.137 bb (solid red line). The US reportedly shipped 1.554 bb during the 2022-2023 marketing year (gray dashed line). Outstanding sales were reported at 304 mb (orange column), putting total sales at 2.78 bb (combined outstanding sales and total shipments). This was up 27% from last marketing year’s total sales of 2.193 bb for the same week. For the record, the 2024-2025 corn export pace projection has dropped roughly 360 mb (12%) from the first week of November (dashed red line) figure of 3.220 bb.
Weekly Activity
- Net sales of 170,400 mt (6.7 mb)
- Down 50% from the previous week and from the prior 4-week average.
- Shipments of 1,229,200 mt (48.4 mb)
- Down 17% from the previous week and 10% from the prior 4-week average.
Next Marketing Year Sales
- Net sales of 3,163,200 mt (124.5 mb) were reported
- with 1,278,900 mt (50 mb) to unknown destinations
- Putting total sales for 2025-2026 at 11,777,500 mt (464 mb)
- China had no 2025-2026 US corn on the books
- Mexico had 4,505,100 mt (177 mb)
- Japan had 1,681,500 mt (66 mb)
- Unknown destinations had 3,047,900 mt (120 mb)
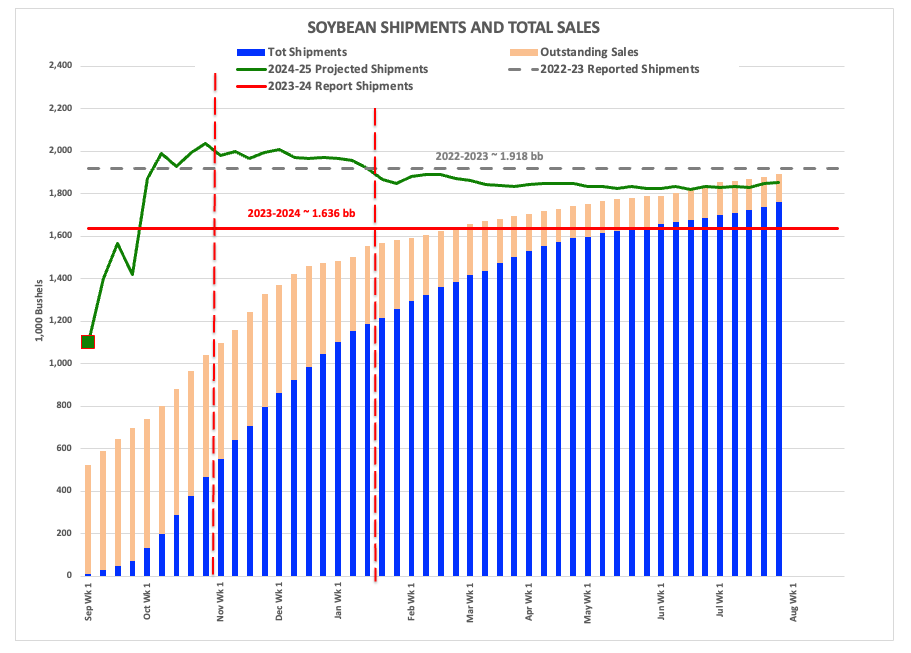
SOYBEANS: 2024-2025 marketing year export shipments of U.S. soybeans ($CNSI) were 1.76 bb, a point in the marketing year when a 5-year average of 95% of what turns out to be total exports have been shipped. This pace projects total 2024-2025 exports of 1.853 bb, up 13% from 2023-2024’s reported shipments of 1.636 bb. The US reportedly shipped 1.918 bb during the 2022-2023 marketing year. Outstanding sales were reported at 132 mb[ii], putting total sales at 1.892 bb. This was also up 13% from last marketing year’s total sales of 1.68 bb for the same week. Similar to corn, the 2024-2025 soybean export pace projection has decreased by 200 mb (10%) from the last week of October figure of 2.035 bb. The pace projection reached a low of 1.831 bb in mid-July.
Weekly Activity
- Net sales of 467,800 mt (17.2 mb)
- Up 71% from the previous week and 63% from the prior 4-week average
- Shipments of 689,500 mt (25.3 mb)
- Up 63% from the previous week and 97% from the prior 4-week average
Next Marketing Year Sales
- Sales of 545,000 mt (20 mb) were reported
- with 254,300 mt (9.3 mb) to unknown destinations
- Putting total sales for 2025-2026 at 3.579 mmt (131.5 mb)
- with unknown destinations holding 1,253,800 mt (46 mb)
- China has no new-crop US soybeans on the books
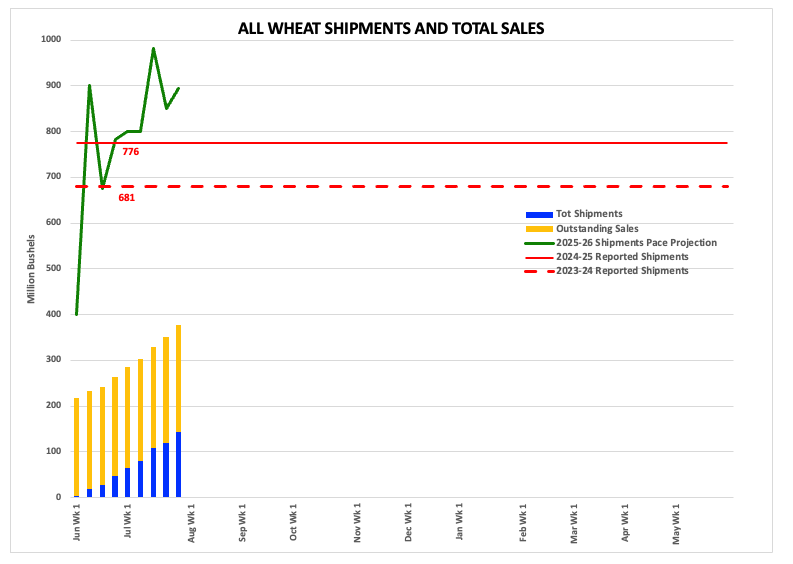
WHEAT: 2025-2026 marketing year export shipments of all U.S. wheat ($CSWI) ($CRWI) ($CRSI) were 143 mb, a point in the marketing year when a 5-year average of 16% of what turns out to be total exports have been shipped. This pace projects total 2025-2026 exports of 894 mb, up 15% from 2024-2025’s reported shipments of 776 mb[iii]. The US reportedly shipped 681 mb during 2023-2024. Outstanding sales were reported at 235 mb, putting total sales at 378 mb. This was up 21% from last marketing year’s total sales for the same week of 312 mb.
Weekly Activity
- Net sales of 737,800 mt (27 mb)
- Up 25% from the previous week
- Shipments of 667,700 mt (24.5 mb)
- Up noticeably from the previous week
Next Marketing Year Sales
- There were no new sales reported
- Leaving total 2026-2027 sales at 47,400 mt
[i] USDA’s latest guess was increased to 2.75 bb from the previous month’s 2.65 bb.
[ii] China had no outstanding sales again this week.
[iii] It is still early in the 2025-2026 marketing year meaning week-to-week changes can be volatile.
On the date of publication, Darin Newsom did not have (either directly or indirectly) positions in any of the securities mentioned in this article. All information and data in this article is solely for informational purposes. For more information please view the Barchart Disclosure Policy here.